3D Structures - Sequence Dependent Analysis
All 3D models
for target: T0192
Group name: 417
Total number of ALL models
submitted for target T0192 : 384
Number of models submitted by group 417 : 4
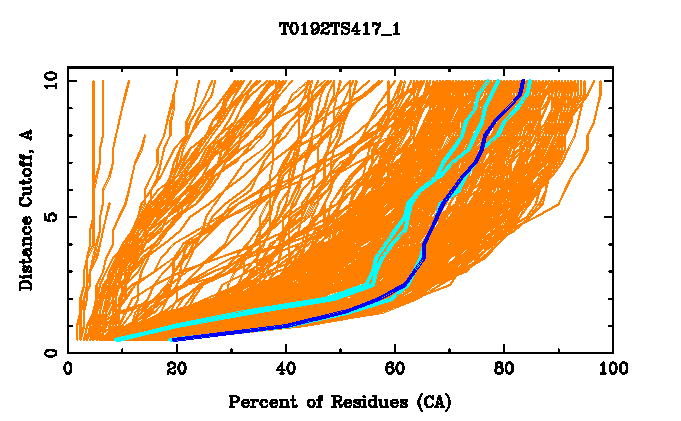
BLUE - Model
- T0192TS417_1
CYAN - Other models submitted by group: 417
BROWN - Models submitted by other groups
GDT analysis: largest set of CA atoms (percent of the modeled structure)
that can fit under
DISTANCE cutoff: 0.5A, 1.0A, 1.5A, ... , 10.0A

Largest set of residues from the Model
T0192TS417_1
that can fit under DISTANCE cutoff :
40 percent of residues ( 68
residues ) fits under 1A with local RMSD 0.70
57 percent of residues ( 97
residues ) fits under 2A with local RMSD 1.06
65 percent of residues ( 111
residues ) fits under 4A with local RMSD 1.46
71 percent of residues ( 120
residues ) fits under 6A with local RMSD 2.53
Percent of the structure predicted: 92.35 (
CA atoms: Model 157 , Target 170 )
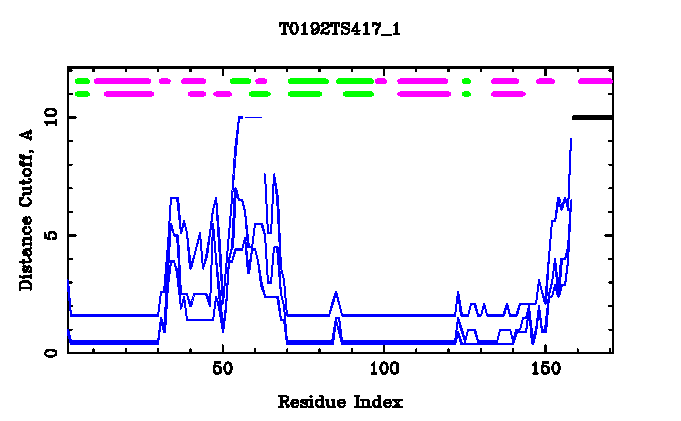
Each residue in the prediction is assigned to the largest set of
residues containing that residue and deviating from the target by no more than a
specified CA distance cutoff.
For a given residue the distance cutoff under
which the set of 5, 10 and 50 percent of the modeled structure can be fitted is
used for graphical presentation (three blue lines).

Target (top row): helices - PURPLE , strands - GREEN
Model (second row): helices - PURPLE , strands - GREEN
Target-Model GDT(5,10,50): BLUE
Bad model or residues not predicted: BLACK
TXT
results, LCS
results (see GDT and LCS
description)
Adam Zemla, 10/21/2002, adamz@llnl.gov


